
Bitcoin addresses' behavior and price action
Bitcoin addresses' behavior and price action
Market signals and the perpetual accumulation mode.

What can the change in the number of addresses holding a certain balance tell us about the price of bitcoin?
Which is the address balance group that has better anticipated market tops, bottoms, corrections or accumulation zones?
Using Coin Metrics’ data of number of addresses by balance we’ll try to answer these questions and point out some interesting address behavior.
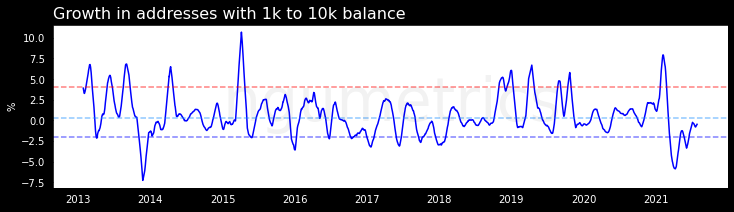
1. Market tops/bottoms or accumulation zones/corrections have been preceded by an extraordinary decrease/increase in the number of addresses that hold 1k-10k bitcoin.

Looking at addresses that hold 1k-10k bitcoin, said to belong mostly to institutional investors, we can see that tops or corrections have occurred in sync with the decrease in the number of addresses in this group (red dots in the chart above). On the contrary, blue dots show an increase in the number of these addresses mostly coinciding with bottoms (dark blue) or phases of accumulation (light blue). The size of the dot shows the intensity of the decrease/increase.
These addresses have keept growing within their historical range and are now showing signs of recovery after the price of bitcoin bottomed.
Addresses holding 10k-100k bitcoin also show a similar growth behavior.
2. Addresses with small balances (said to belong to retail investors), had hardly ever shown a significant decline in their numbers. Nevertheless, their growth has slowed down significantly.
The chart below shows addresses with a balance of 0.001 to 0.01 bitcoin. The number of this type of addresses has hardly ever declined significantly (few red dots) and it has shown extraordinary growth during bull runs and at market tops. One could say that the growth behavior of these type of addresses suggests retail is in perpetual accumulation mode.

Charts of addresses in other groups of small balances look very similar as the one above.
However, the growth in addresses holding small balances slowed down after the 2018 market top (see chart below belonging to addresses with 0.001 to 0.01 bitcoin in balance). Charts for addresses holding 0.01 to 0.1 and 0.1 to 1 bitcoin look quite similar.

Takeaways
Extraordinary movements in addresses holding 1k to 10k bitcoin have been in sync with market tops/bottoms or corrections/accumulation zones. In general, the number of this type of addresses decreases/increases near a market top/bottom or at corrections/accumulation zones.
The growth in addresses that hold small balances suggest retail investors as a group are in perpetual accumulation mode, growing stronger during bull runs and specially near market tops. This also suggests that retail follows price.
Institutional investors (address with balance of 1k to 100k) have continued to grow around historical rates, while retail (addresses with small balances) growth has slowed down significantly after the 2018 market top.
Very interesting, thanks for sharing Julio