
Bitcoin price metrics to assess market tops
Bitcoin price metrics to assess market tops
Measuring price metric performance at the top and getting an end-of-year price target range.

How could the next bitcoin price top look like? How could we know if we are near or at the top of this cycle in terms of price?
Let’s use some price metrics that can guide us, evaluate their performance to correctly signal a market top and build a range of what could be this cycle’s price top.
Price metrics: the expanding bands
To estimate the price top we’ll use bitcoin’s price expanding bands metric. I wrote about this in a previous article named The bitcoin expanding average bands indicator.
In that article I only used the expanding average metric, however, now we are going to add similar metrics for evaluation purposes. These include:
1. The 4-year moving average (blue line in the chart below).
2. The expanding exponential standard deviation (green dotted line).
3. The expanding standard deviation (red line).
4. The expanding exponential average (black dashed line).
The expanding average I wrote about before is the orange line.
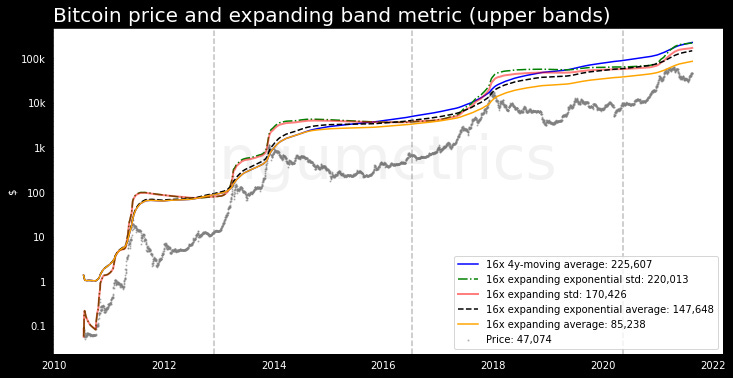
Visually all these metrics seem to have signaled price tops quite well in previous cycles. However, which one(s) have performed better? Let’s do this analysis next.
Price bands metric performance
The chart below shows the performance of these metrics measured as how close they were to the actual price top. In the chart, the closer to 0 (gray horizontal dashed line) the more accurate the metric.
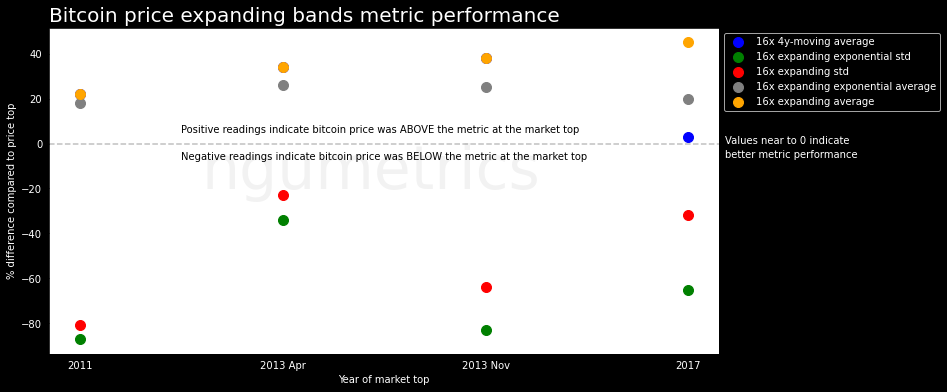
Focus on the gray dots and on the blue dot.
The blue dot is the 4-year daily moving average, which in the previous cycle signaled the top when the difference between the price and this metric was only 3% of price. This was a pretty accurate metric, but the issue is that we only have one data point to measure its performance.
The gray dots are the expanding exponential average, which have signaled the top when the difference between the price and this metric has been 18%-26% of price. The good thing about this metric compared to the 4-year daily moving average is that we have more data points to evaluate it, and that it also shows less variability compared to the other metrics.
The other metrics (orange, red and green dots) show worst performance and have had bigger variance when signaling price tops.
Expanding bands price target
To estimate the level bitcoin’s price could reach at the top of this cycle we use the 4-year moving average and the expanding exponential average metrics. As you saw in the first chart, these metrics have a current value of about $226k and $148k respectively.
However, the value of these metrics change daily and will most likely continue to do so at least for the rest of this year. Taking into account how these two metrics are growing we extend the series to the end of 2021. See the results in the chart below.
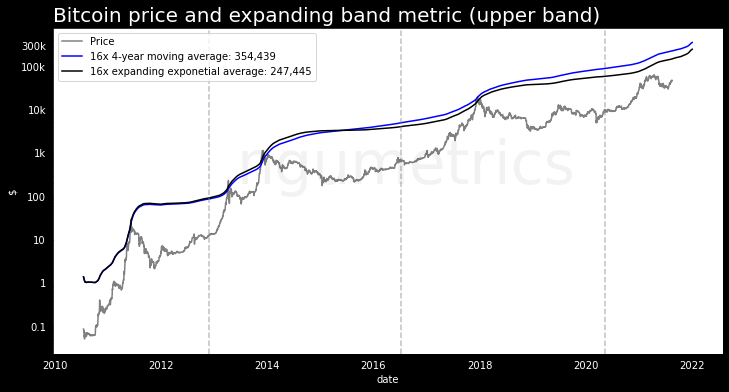
The end-of-year values are $354k for the 4-year moving average (blue line) and $247k for the expanding exponential average (black line). Correcting for metric performance the price of bitcoin could be between $300k-$365k at the top of this cycle (assuming the top is reached in this time frame).
Caveats
The numbers presented here are not a forecast, they are only indicators of possible market tops.
The extended values for the metrics assume a similar behavior continues moving forward. Although this is likely as the trend of these metrics doesn’t change drastically in a short period of time, their ultimate value depends on the evolution of bitcoin’s price.
Nice metrics as usual Julio, do you have a website with live charts for the expanding bands?
thanks for the content, as usual!