
Categorizing bitcoin price behavior
Categorizing bitcoin price behavior
What is "normal" and what is not, about bitcoin price movements and how it could help anticipate trends.

If you follow the bitcoin price on a daily basis, have you ever wondered if the movements in a given day were “normal”? or if the price behavior in a particular day was telling you something you really should have been putting attention to?
Well, I found that the daily bitcoin price behavior can be categorized as a function of its intraday movements and its daily technical indicators. Indeed, I suggest that there are 4 ways in which we can categorize the daily price behavior: “normal days”, “bull days”, “reversal days” (2 types within this category ) and “the outlier”.
Furthermore, mapping price behavior to the bitcoin price time series can be of great help for anticipating important movements in the bitcoin price.
There are 4 ways in which we can categorize the daily bitcoin price behavior: “normal days”, “bull days”, “reversal days” (2 types within this category ) and “the outlier”.
The process of categorizing bitcoin’s price behavior.
The data consists of bitcoin prices each minute from August 2010 to February 2021. The source is the minute-to-minute bitcoin price and exchange volume from Bitstamp’s API (see an example in the next chart below).
I extracted features from each day (mean, median, standard deviation, minimum, maximum, z-score, min-max range, exchange volume, technical indicators as MACD, RSI, etc.)
Then I used unsupervised machine learning algorithms to find days with similar patterns (clusters). The algorithm assigns each day to a specific type of price behavior.


Price behavior categorization.
Using price data from each day and the type of behavior it was assigned to, I categorized daily bitcoin price movements as follow:
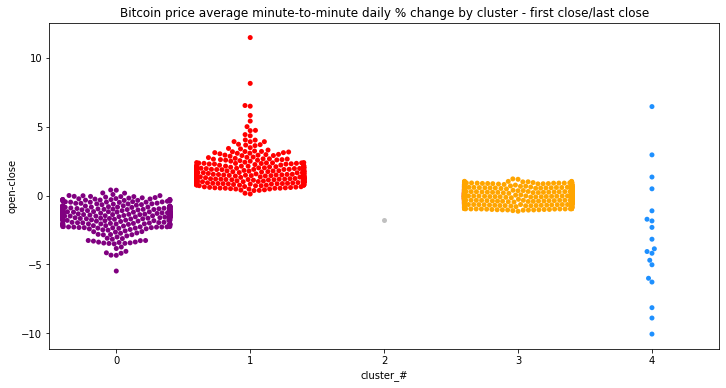
“Normal days”, Cluster #3, low volatility, small price movements.
“Bull days”, Cluster #1, volatility to the upside.
“Reversal days”, Clusters #0 and #4, higher volatility, price reverses almost all of the daily gains/losses.
Cluster #2, “the outlier”.
The chart below show intraday price movements in % terms by price behavior category.
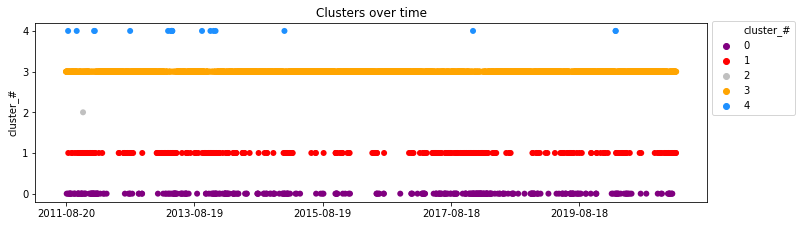
Mapping price behavior to bitcoin price time series.
Indeed, Cluster #4 includes days 2020-03-12 and 2020-03-13, the two days of the big market sell-off related to the COVID-19 pandemic.
Now to the fun part.
Next I mapped the bitcoin price time series with the resulting price behavior for each day (next two charts below) to see if certain types of days could be associated with or used to anticipate important movements in the bitcoin price.

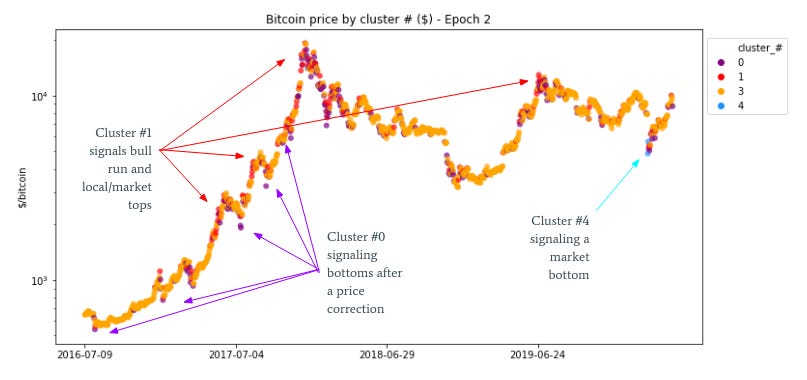
Regarding daily bitcoin price behavior, we can see that:
The majority of the days correspond to cluster #3. As I said above, days in this cluster could be thought as the "normal days", where the price of bitcoin has low volatility, and as it corresponds to the most common price behavior.
Cluster #1, “bull days”, shows times when the bitcoin price increases sharply (during, and/or at the end of bull cycles).
Days in clusters #0 and #4 (“reversal days”) are typically seen after a correction in prices and/or at the end of bear cycles. Cluster #4 is less common than #0 and seems to appear only after sharp corrections and/or to signal market bottoms. Indeed, Cluster #4 includes days 2020-03-12 and 2020-03-13, the two days of the big market sell-off related to the COVID-19 pandemic.
Cluster #2 or “the outlier” has only one day (2011-11-25), which must be seen as an outlier.
Zooming into a specific bitcoin price epoch (between halvings) we can see how clusters were related to price movements.
Conclusions
The daily bitcoin price can be categorized by its intraday movements and technical indicators. I suggest 4 types of daily price categories: “normal days”, “bull days”, “reversal days” (2 clusters) and “the outlier”.
By mapping cluster data to bitcoin price time series we can see how clusters are related to price movements and could anticipate emerging trends . We found that cluster #1 (bull days) is associated with market tops, and that clusters #0 and #4 with market bottoms or end of price corrections. Cluster #3 corresponds to “normal days” (most common cluster and less volatile).
Future work
Develop a quantitative model that predicts price movements using cluster data.
Use technical indicators specifically related to bitcoin to find clusters (SOPR, Coin Days Destroyed, Puell Multiple, Realized HODL ratio, Realized profit, MVRV, etc).
Include other types of features related to the bitcoin network. We could add information about the bitcoin network to the dataset. This could include, daily data of active addresses, transactions, mining difficulty, issuance, etc.