
Dissecting bitcoin price All-Time-Highs and the All-Time-High index.
Dissecting bitcoin price All-Time-Highs and the All-Time-High index.
How to know when we are reaching new All-Time-Highs too fast and what to expect ahead.

Bitcoin’s price could be reaching new All-Time-Highs (ATHs) in the next few months. What is/has been the price behavior at that point in the cycle? If we are reaching ATH after ATH, how to know if we are going too fast and what to expect ahead? Let’s try to answer these questions with some visualizations.
1. ATHs historically.
The chart below shows bitcoin’s price and ATHs (red dots). Obviously new ATHs are reached when we are well in a bull market and with great velocity.

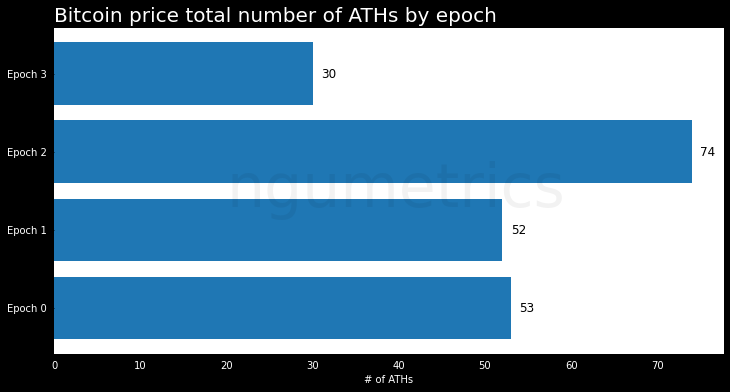
2. Total number of ATHs.
By visualizing ATHs by epoch we see that epoch 2 had the most number of new ATHs with 74, epoch 0 and 1 were similar with 53 and 52 ATHs respectively (although epoch 0 has less price data). So far this epoch we have had 30 fresh ATHs (keep in mind that this epoch is not over yet).
3. ATHs time series by epoch.
We can also visualize ATHs as a time series by epoch as shown in the chart below. We can see here how the ATH series resemble an s-curve. This shows how fast new ATHs can be reached when bitcoin is in a bull run.
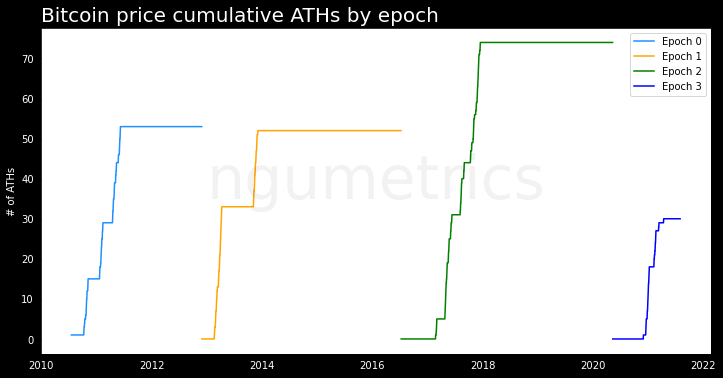
Another way of visualizing this same data is by overlapping the cumulative ATHs by epoch as in the chart below.

This chart tells us that the number of cumulative ATHs in the current epoch 3 were coming faster than in the previous epoch 2. However, right now we are below previous epochs in terms of number of ATHs. In theory, there is a lot of room left to reach fresh ATHs.
4. How fast is fast in terms of reaching new ATHs? The ATH index.
To answer this I developed a price ATH index (light blue bars in the chart below). The index has values between 0 and 100 and represents the share of days bitcoin has reached new ATHs in the last 30 days.
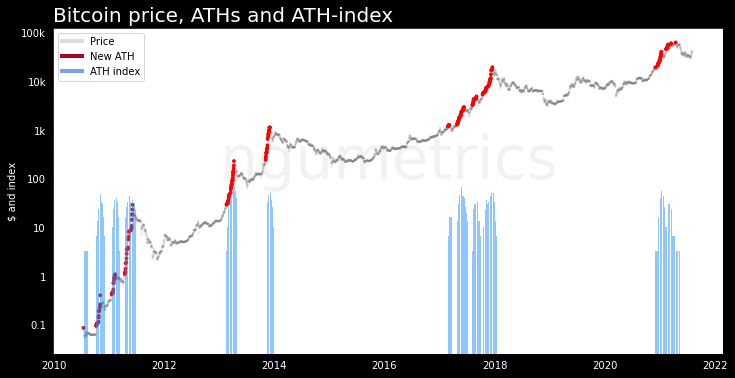
Historically, the index has topped at 50-70, and a value above 40 seems to signal we are reaching new ATHs too fast and a price correction is probable. Right now we have reset to 0 after reaching 57 in January 8, 2021.
PS. This article was inspired by a chart from ChartsBtc (twitter: @ChartsBtc), take a look at it here, and go follow him on twitter if you don’t already.
Raw price data from Coin Metrics (twitter: @coinmetrics).