
The 100-consecutive-days-above bitcoin price metric
The 100-consecutive-days-above bitcoin price metric
How to assess if the price of bitcoin is not going to fall below a certain level anymore.

How can we know if the price of bitcoin is not going to fall below a certain level anymore?
This is an important question that we all would want to know the answer to. Although not an exact science, we can use a metric to assess this and have some confidence about bitcoin’s price not going below a certain level.
I call this metric the 100-consecutive-days-above indicator or 100cda (perhaps it needs a better name).
It measures how many consecutive days the bitcoin price has been above a certain level. The chart below shows this for selected price levels.

What is interesting about this metric is that it shows that once the price of bitcoin has closed above a certain price level for 100 consecutive days (gray horizontal dashed line in the chart) it most likely will never go below that price level (with a few exceptions over bitcoin’s price history).
In the above chart you can see that the price of bitcoin has been above $20K and $30K for more than 100 consecutive days, so we would consider it will never go below these levels. For $40K it reached exactly 100 consecutive days, and 49 for $50K, however it couldn’t pierce above this metric.
100-consecutive-days-above price
From this metric we can also calculate the maximum level the bitcoin price has been above for more than 100 consecutive days. I call this metric the 100-consecutive-days-above price or 100cda price (suggestions for a better name welcomed). The chart below shows this (yellow line).
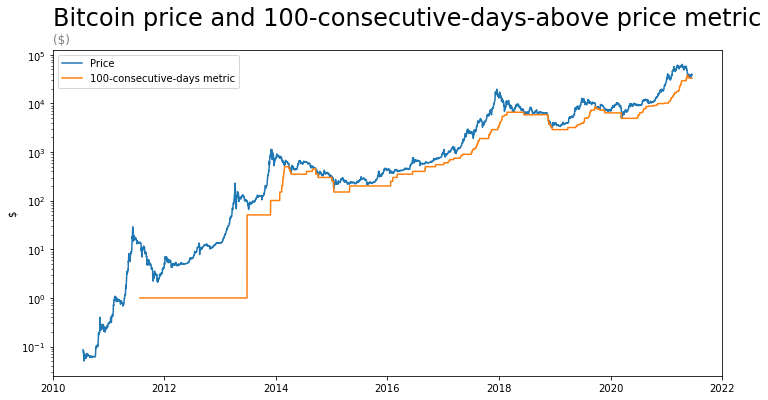
Right now the 100cda price stands at $33,200. We should keep an eye on the bitcoin price not going below this level as bitcoin prices have fallen significantly when going below the 100cda price.
PS: I first published this indicator on twitter in September 2020. At the time there were discussions about bitcoin’s price staying above $10,000 or not. You can see the original post here.