
Estimating bitcoin's market cap from active addresses
Estimating bitcoin's market cap from active addresses
Is bitcoin under or overvalued according to its number of active users?

In this article we estimate bitcoin’s market cap from the total number of users.
Estimating bitcoin’s market cap from the number of users is an application of Metcalfe’s law, which states that “the value of a telecommunications network is proportional to the square of the number of connected users of the system”1
So basically the market cap of bitcoin (V) should be equal to the square of the number of users (n).
In terms of a formula:
V = A * n ²
A is called the proportionality factor, which measures how much value does a new user adds to the network.
Metcalfe’s law has been successfully applied to value Facebook and Tencent. For bitcoin valuation, Timothy F. Peterson2 showed that “bitcoin’s medium- to long-term price follows Metcalfe’s law”.
In his research, Peterson uses the following model specification:
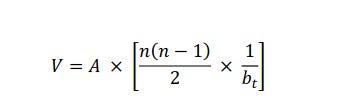
with bt being the total number of bitcoin in existence at time t, total number of wallets is users (n), data from blockchain.info, and assuming A is constant (which he aknowlegdes it is likely not).
Our model
For our model:
We use coinmetrics.io daily data of number of bitcoin active addresses (AdrActCnt) as users (n) and the market cap in US$ (CapMrktCurUSD) of bitcoin as value (V).
We don’t assume that A is constant, instead we estimate A overtime from the data.
We use different values of A to estimate bitcoin’s market cap and assess if it is under or overvalued.
The chart below shows the value of A overtime (A = market cap / active addresses²).
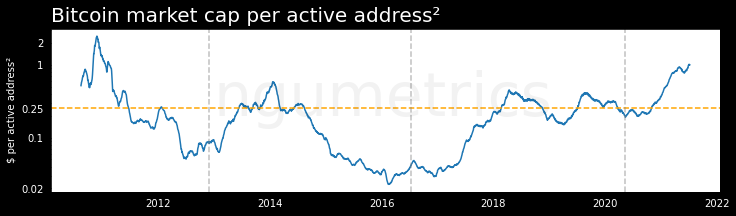
We can see that the value of A varies over time. An increasing value of A indicates that new users add more value to the network at the margin and vice-versa. The value of A has been trending up since 2016, hovering around 1.0 currently. The all-time average is 0.25 (dashed orange line), the lowest is 0.02 and the highest is 2.46.
Using different values of A, we can estimate what the market cap of bitcoin should be according to the number of daily active addresses. This is shown in the chart below.
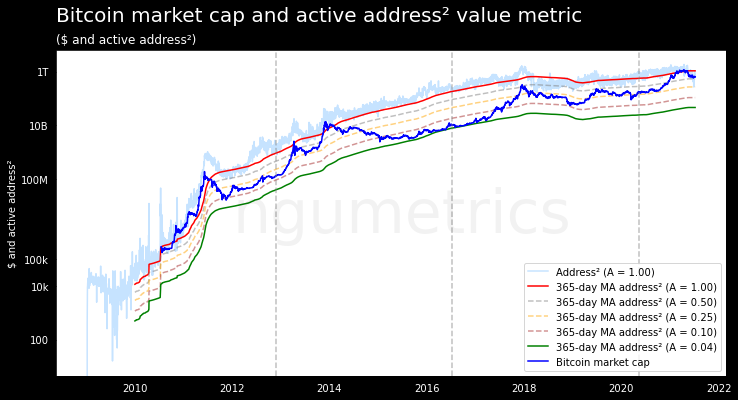
From the chart we can conclude that:
Bitcoin’s market cap hardly goes above the value estimated when A = 1 (light blue and red line). In a bull market these values represent a top for bitcoin’s market cap.
When in a bear market, bitcoin’s market cap will hardly go below the value estimated when A is between 0.04 (15% percentile) and 0.10.
The model estimates Bitcoin’s market cap to be around $1.08T (red line, A = 1) and $0.54T (orange dashed line, A = 0.25 which is the historical average for A), compared to current market cap of $0.64T. The orange line was support in the 2013 bull market.
Under this model, for bitcoin’s market cap to reach fresh highs, we would need daily active addresses to resume their upward trend again, as they have been decreasing since around April.
https://en.wikipedia.org/wiki/Metcalfe%27s_law
https://papers.ssrn.com/sol3/papers.cfm?abstract_id=3078248&download=yes
loved this idea, recreated it in glassnode's workbench